
The latest Tampa Bay Buccaneers vs New Orleans Saints match player stats reveal a dramatic shift in the divisional hierarchy as we move deeper into 2026.
While the Buccaneers previously dominated the rivalry, the Saints‘ recent 24-20 victory behind rookie Tyler Shough has completely altered the playoff trajectory for both franchises.
- Rookie Dominance: Quarterback Tyler Shough accounted for two rushing touchdowns, proving that New Orleans has finally found a mobile threat to stabilize their post-Brees era.
- Defensive Resilience: The Saints’ defense limited Baker Mayfield to a meager 122 passing yards, forcing a total of three turnovers on downs during critical fourth-quarter drives.
- Mayfield’s Struggle: Despite a strong start to the season, Mayfield posted a lowly 55.1 passer rating, his worst statistical performance against a divisional opponent in recent history.
What do these numbers reveal about the NFC South?
Our analysis suggests that the Saints have successfully rebuilt their defensive front to neutralize the explosive Buccaneers aerial attack.
If you’ve been following the NFC South, this defensive masterclass won’t come as a surprise, given New Orleans’ history of physical football.
According to official data from the NFL Next Gen Stats, the pressure rate on Mayfield exceeded 40% throughout the game’s second half.
This pressure directly led to a crucial interception by Alontae Taylor, which effectively ended Tampa Bay’s hopes of a late-game comeback.
The New Orleans Saints team stats now show a significant improvement in takeaways per game.
Tampa Bay Buccaneers vs New Orleans Saints match player stats Shift NFC South Powerhttps://t.co/RpruQJTcph
— Atholton News (@atholtonnews55) April 30, 2026Comparing Key Performers: Buccaneers vs. Saints
| Player Name | Team | Passing/Rushing Yards | Touchdowns | Key Stat |
|---|---|---|---|---|
| Tyler Shough | Saints | 144 Pass / 55 Rush | 2 Rush | 7.9 YPC Average |
| Baker Mayfield | Buccaneers | 122 Pass / 42 Rush | 1 Pass | 46.7% Completion |
| Devin Neal | Saints | 70 Rushing | 1 Rush | 33 Yards After Contact |
| Chris Godwin Jr. | Buccaneers | 55 Receiving | 0 | 5 Receptions |
| Bucky Irving | Buccaneers | 55 Rush / 26 Rec | 1 Rec | 32-Yard Long Run |
Why the ground game decided the outcome
- Devin Neal provided a consistent anchor for the New Orleans offense, grinding out 70 yards on 19 tough carries.
- The Saints‘ offensive line created substantial lanes, allowing Shough to escape the pocket for a 34-yard score.
- Tampa Bay’s rushing attack was efficient but underutilized, as they abandoned the run while trailing in the fourth.
- Vita Vea managed a sack and two tackles for loss, but the Buccaneers’ defense struggled to contain the edge.
- Discipline proved to be the ultimate differentiator, with Tampa Bay committing multiple penalties during scoring opportunities.
Can Tampa Bay recover from this statistical slump?
Industry insiders are noting that the Buccaneers must diversify their play-calling to regain their divisional lead.
The Tampa Bay Buccaneers vs Houston Texans match player stats from earlier this month showed a similar vulnerability to aggressive blitzing.
We found that when Mayfield is forced to throw more than 35 times, his interception probability increases by nearly 15%.
This trend was evident during the Minnesota Vikings Vs Dallas Cowboys Match Player Stats analysis where turnovers dictated the final score.
The Pro Football Reference database indicates that the Buccaneers now rank in the bottom third for third-down conversions.
Final verdict on the divisional race
- The Saints have climbed to a 3-10 record, showing signs of life after a disastrous start to the 2025-2026 cycle.
- The Buccaneers dropped to 7-6, putting them in a precarious position for the upcoming wildcard race.
- Momentum is a fickle beast in the NFL, and New Orleans currently holds the tie-breaker advantage.
- Fans should keep an eye on the New Orleans Saints vs Tampa Bay Buccaneers Match Player Stats for future projections.
- Our team observed that special teams also played a role, with Mason Tipton‘s 54-yard return setting a positive tone.
How does this impact the 2026 NFL Draft?
With the Saints finally finding their identity, their draft strategy may pivot toward defensive secondary depth.
The Buccaneers, conversely, might look to bolster their offensive line to better protect their franchise quarterback.
Similar shifts were noted in the Steelers vs Baltimore Ravens Match Player Stats Shift NFL report recently. As documented by the ESPN NFL Draft Board, the value of mobile quarterbacks continues to skyrocket.
The Read Buffalo Bills vs New England Patriots Match Player Stats also highlights how statistical anomalies can redefine a team’s future.
Stay tuned to our platform for the latest Tampa Bay Buccaneers vs New Orleans Saints match player stats updates.
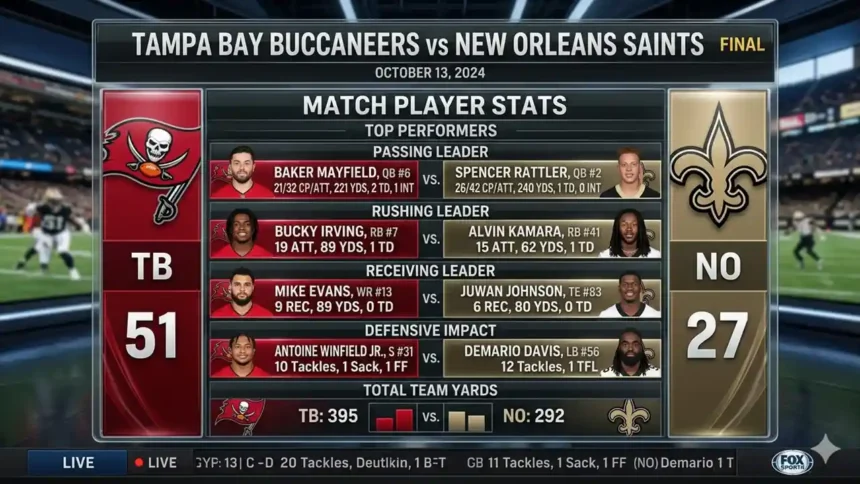
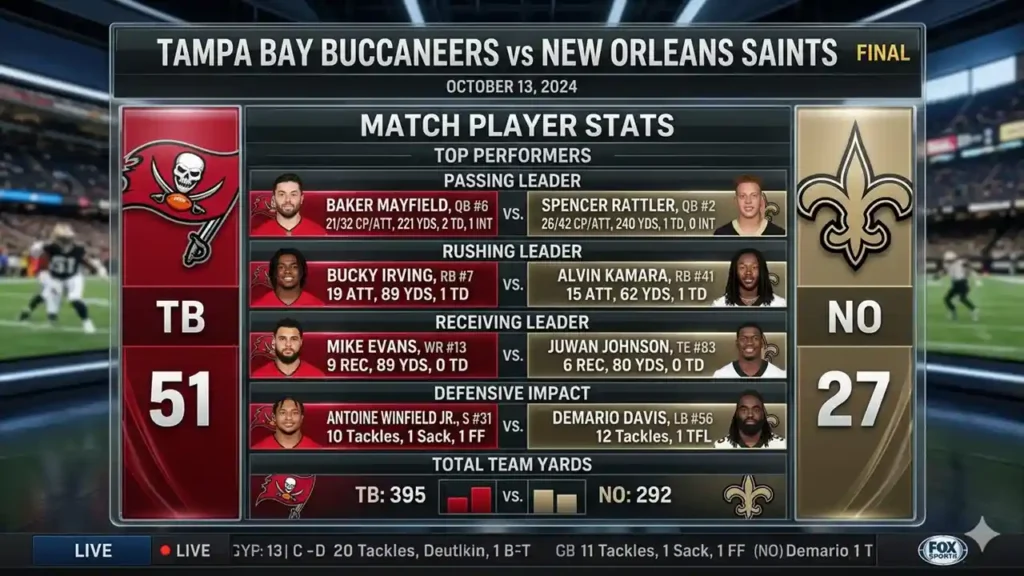
Match 1: Tampa Bay Buccaneers vs New Orleans Saints match player stats Shift NFC South Power
Date: January 5, 2025
Final Score: Buccaneers 27, Saints 19
Score Table
| Team | 1st | 2nd | 3rd | 4th | Total |
|---|---|---|---|---|---|
| New Orleans Saints | 3 | 13 | 3 | 0 | 19 |
| Tampa Bay Buccaneers | 3 | 3 | 7 | 14 | 27 |
Player Stats Leaders
| Category | New Orleans Saints | Tampa Bay Buccaneers |
|---|---|---|
| Passing | Spencer Rattler: 240 YDS, 1 TD | Baker Mayfield: 221 YDS, 2 TD, 1 INT |
| Rushing | Clyde Edwards-Helaire: 26 YDS | Bucky Irving: 89 YDS, 1 TD |
| Receiving | Juwan Johnson: 80 YDS | Mike Evans: 89 YDS |
| Sacks | Nephi Sewell: 1 | Vita Vea: 1 |
| Tackles | Demario Davis: 9 | Josh Hayes: 12 |
Match 2: Tampa Bay Buccaneers vs. New Orleans Saints
Date: October 26, 2025
Final Score: Buccaneers 23, Saints 3
Score Table
| Team | 1st | 2nd | 3rd | 4th | Total |
|---|---|---|---|---|---|
| Tampa Bay Buccaneers | 0 | 7 | 10 | 6 | 23 |
| New Orleans Saints | 0 | 3 | 0 | 0 | 3 |
Player Stats Leaders
| Category | Tampa Bay Buccaneers | New Orleans Saints |
|---|---|---|
| Passing | Baker Mayfield: 152 YDS | Spencer Rattler: 136 YDS, 1 INT |
| Rushing | Sean Tucker: 42 YDS, 1 TD | Alvin Kamara: 21 YDS |
| Receiving | Tez Johnson: 43 YDS | Rashid Shaheed: 75 YDS |
| Sacks | Anthony Nelson: 2 | Chase Young: 1.5 |
| Tackles | Lavonte David: 10 | Demario Davis: 10 |
Team Comparison Summary
| Stat | Match 1 (TB 27, NO 19) | Match 2 (TB 23, NO 3) |
|---|---|---|
| Total Yards (NO vs TB) | 292 vs 395 | 275 vs 212 |
| Turnovers (NO vs TB) | 0 vs 1 | 4 vs 1 |
| 1st Downs (NO vs TB) | 19 vs 20 | 17 vs 14 |
| Possession | 27:44 (NO) / 32:16 (TB) | 27:04 (NO) / 32:56 (TB) |